


Just The Graphs #1

Get up-to-date info at a glance. This series provides readers with graphs relevant to credit, monetary policy, and banking stability. Click on source links to interact with graphs.
Federal Funds Rate + Target Ranges
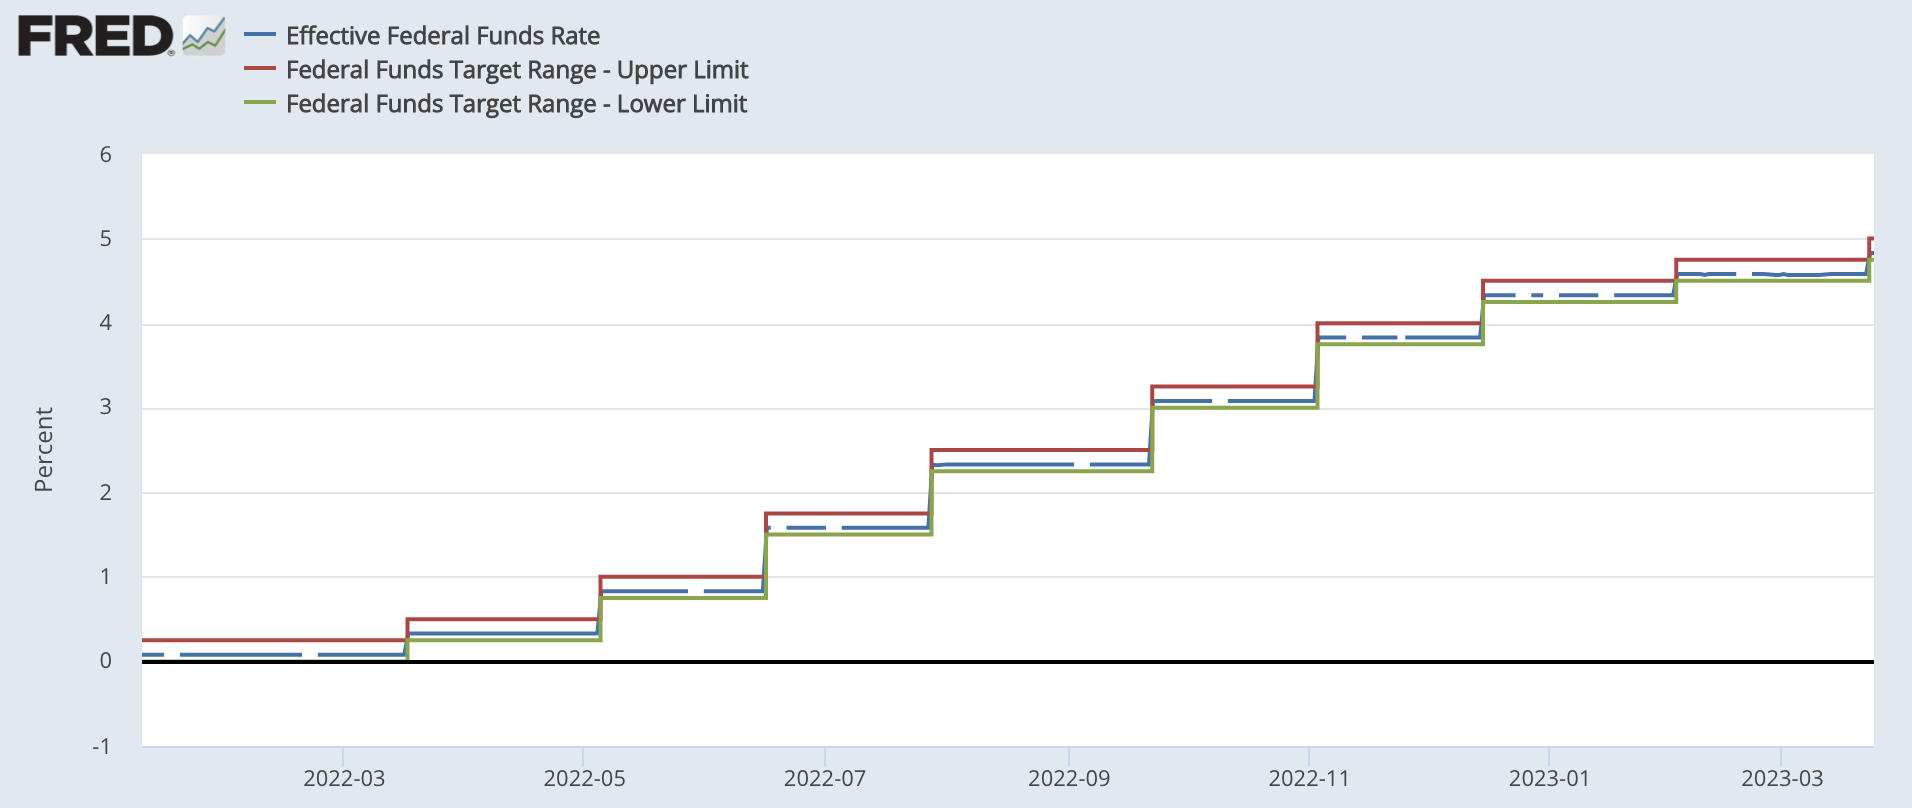
On May 3, the Fed set the target for the federal funds rate between 5% and 5.25%. The Effective Federal Funds Rate is the market rate at which banks and other financial institutions lend each other deposits at the Federal Reserve.
Important Yield Rates

SOFR is the rate for secured lending. It is calculated based on trades in the US tri-party repo market.
Interest on reserves (IORB) is the interest the Fed pays banks for simply holding a balance with them.
Reverse Repo (RRP) is the rate the Fed pays for “borrowing” reserves from financial institutions on a secured basis.
IORB and RRP help the Fed set a floor on interest rates.
Yield Curve
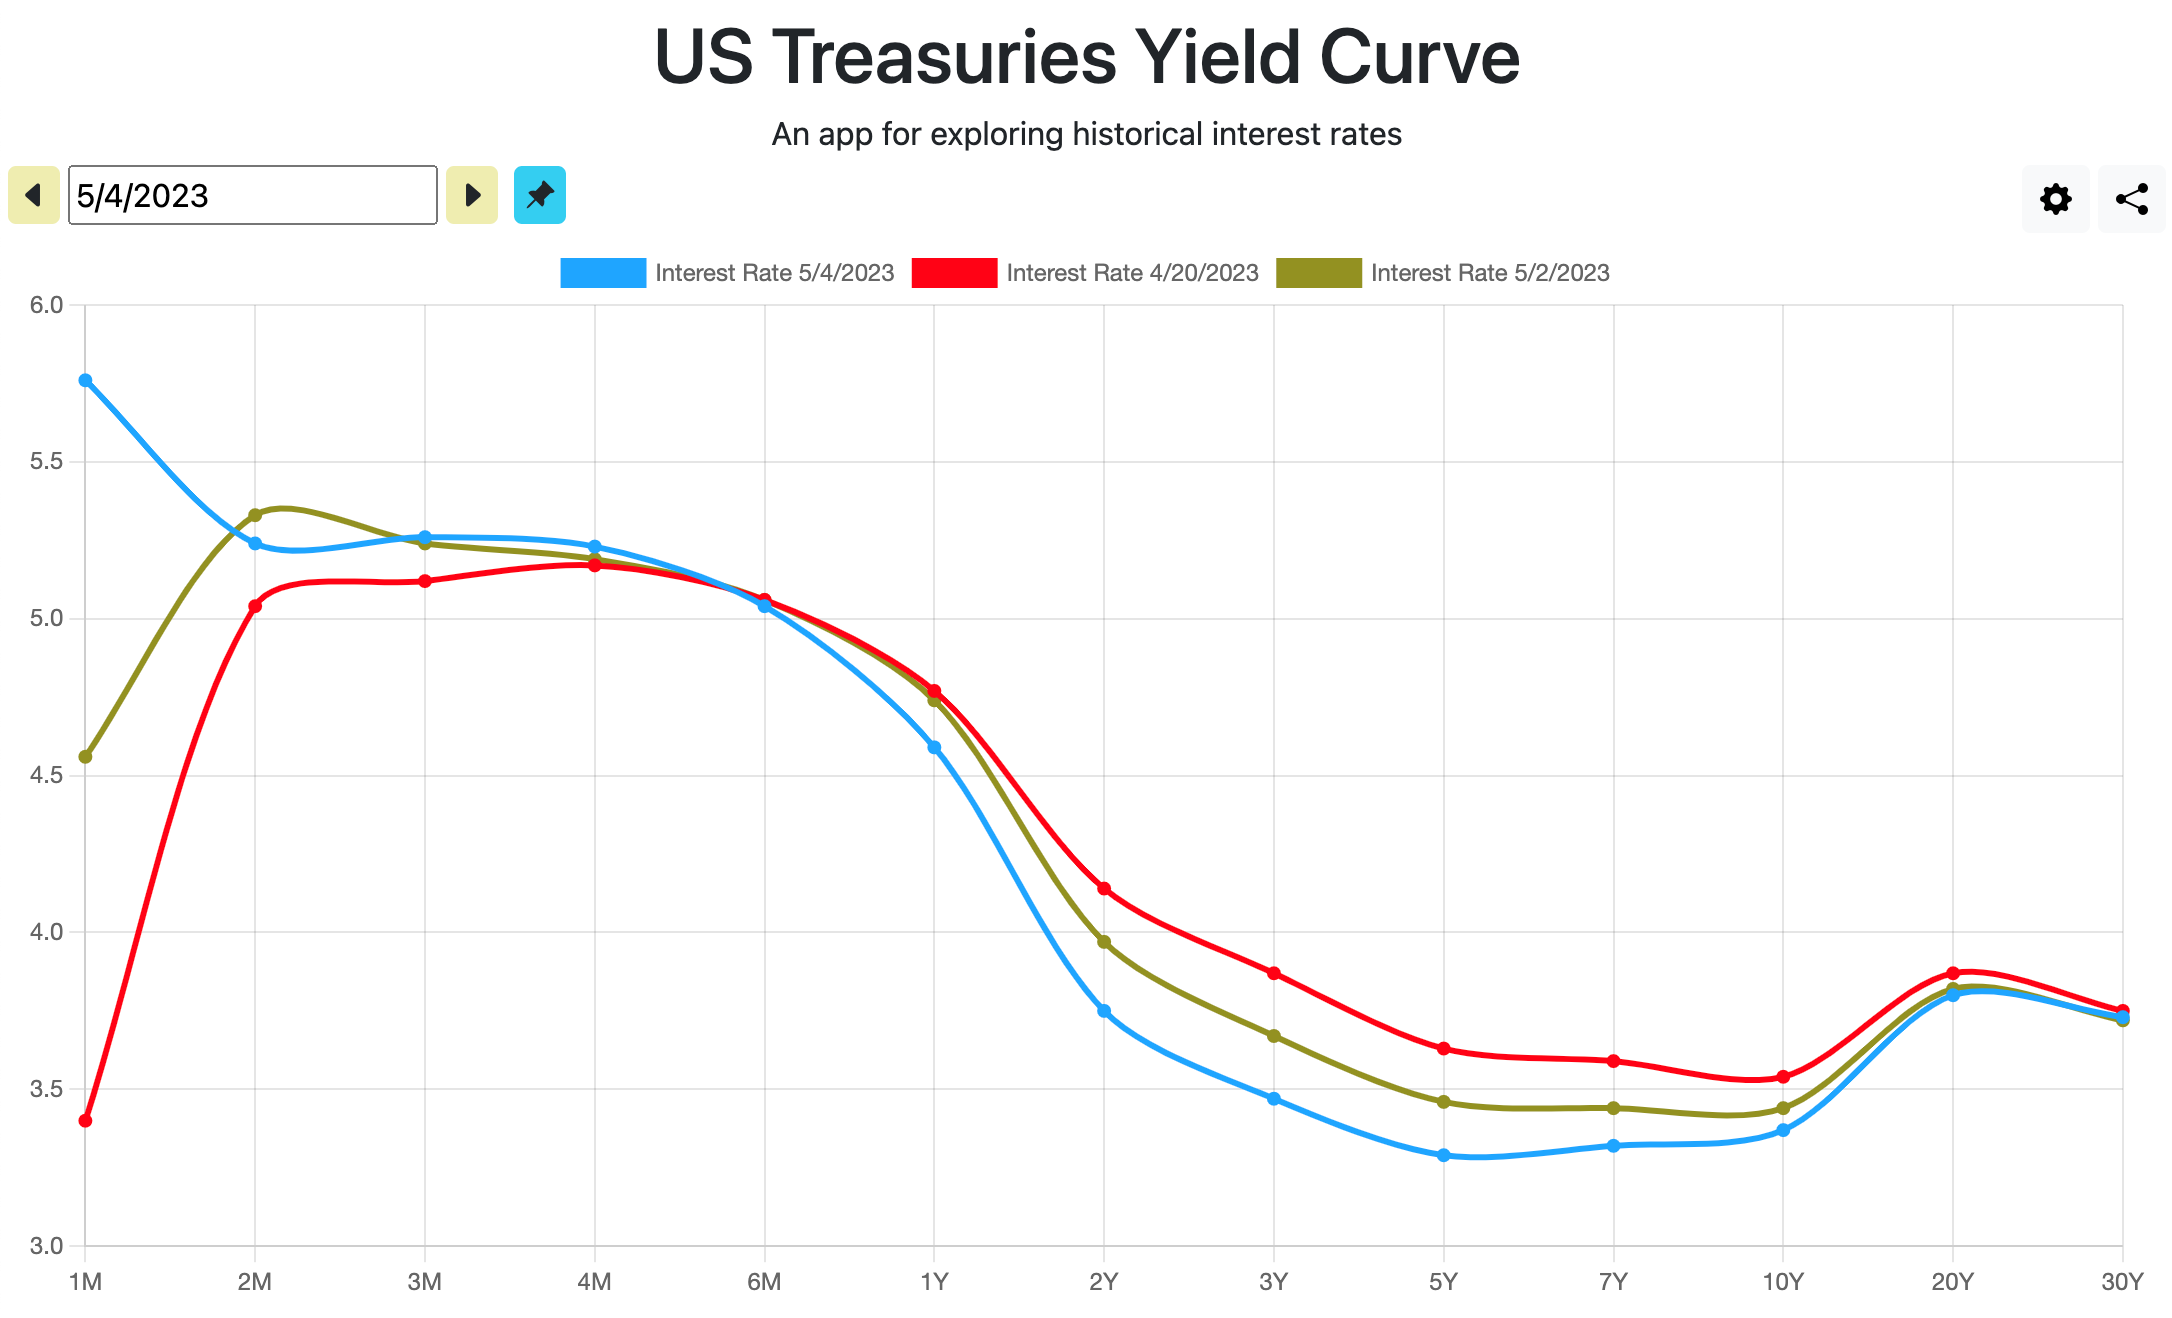
Each plot line represents yield generated by specific treasuries on a specific date. Plot lines include:
5/4/2023 (blue)
5/2/2023 (green)
4/20/2023 (red)
Each point on the curve marks the yield generated (y-axis) for US treasuries of different maturities (x-axis).
Bank Performance

A popular index used to measure the performance of the banking sector.
Fed Liquidity Offerings

In times of financial stress, financial institutions borrow money directly from the central bank.
Not Enough Graphs?
Did I miss a graph you were interested in? Let me know in the comments!